Process Control & Control Charts
The assignment was completed by Abhishek Patil with the use of resources from 3D e-book: chapter
10, 11, 12 and the control chart templates created by Paul G. Ranky.
Introduction and Objectives of Project
A&P eco-MHE is a private company which manufactures automated Omni – directional forklifts. We
provide a wide range of customization and material handling solutions to customers globally. The
company uses mecanum wheels to give Omni directional mobility to a lift truck. This allows normal
forward and backward motions like the conventional wheel, but also provides sideways motion and
rotation about it center of gravity. The parts used in the assembly of each forklift are
interchangeable. Our cutting edge technology ensures high efficiency and quality by obtaining high
mobile accuracy and sustainable engineering. We also provide onsite training sessions for
operating the forklifts along with maintenance service.
The main objective of this project is to analyze data, process variables and attributes to determine if
the process is in control and if not take corrective steps in order to obtain control over process and
quality as an output. The control charts will be used to analyze the data collected for variables and
attributes in order to maintain the customer specified quality through process control. The main
objective of A&P Eco – Material handling Equipments will be to reduce the variations in order to
improve the process and lower the waste and cost. The aim will be to maintain the process
parameters along with the quality within a certain range of acceptable standards in order to obtain
operational efficiency and the customer defined quality. Our main aim will be to establish process
sustainability through process control with the help of control charts.
The control charts represents deviations from the mean and spread of measured values graphically.
Control charts can be used for hypothesis testing for quality checks and make accept or reject
decisions. The important feature of the control charts is that effects of several factors on the
process can be obtained in a graphical representation which is easy to interpret visually (by the use
of MINITAB).
Description of Methodologies Applied
A&P Eco-MHE concentrates on the aim of quality in order to obtain customer satisfaction along with
the functional requirements defined for the product. The quality of the product is mainly driven by
manufacturing process, thus process control becomes the main aim of the company. The out of
control processes are effectively managed by the use of control charts Beta Version provided by
Prof. Paul Ranky. This procedure helps reduce the variations. Control charts are plotted for
variables which are measured in quantitative units and the attributes which are measured as count.
The control charts are used in A&P Eco-MHE on a large scale to observe the efficiency of machines
to reduce the defects in batch system. By continuous monitoring the process, we can ensure
reduced variability in the products by confirmation to the specifications. A data sample is created to
determine defects and the effects of critical factors on the process and thus the source of variation
can also be determined.
Thus the statistical control charts are the continuous monitoring tool, which monitors the entire
process and maintains the process in control by eliminating the variations. The plotted values in the
control charts help to evaluate the mean value for the sample as well as the standard deviation
(variation). The mean value is used to plot the X bar charts and the standard deviation is used to
plot the R chart.
Variable control Charts
A&P Eco-MHE uses variable control charts to focus on production quality.
X bar chart: It is a control chart for variation of the mean value of characteristic. The X bar
chart is developed form the range of each subgroup data.
R chart: R chart is developed from the ranges of each subgroup data, which is calculated
by subtracting the maximum and minimum value in each subgroup.
X bar and R charts are used for those processes that have high sample size (more than 30).
Attribute Control Charts
These charts control quality utilizing either mean or range of unit sets. They have a purpose to
control variability and mean. P-chart, C-chart and U-chart are the attribute control charts.
P chart: This control chart shows the fraction of non-conforming or defective product produced by
manufacturing process.
C chart: This chart shows the number of defects or non-conforming products produced by the
manufacturing process.
U chart: This chart shows the non-conformity per unit produced by the manufacturing process.
Main Body of the Project
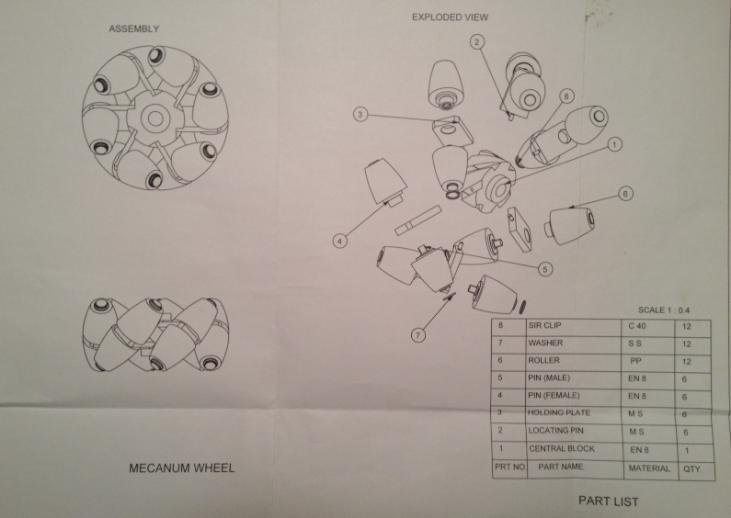
A&P Eco-MHE will focus on the manufacturing of the mecanum wheels for the forklifts. The
mecanum wheel is a critical part of the forklift as all the movements of the forklift and the
smoothness of the movement on the shop floor depends upon the precision of mecanum wheel.
Following diagram gives an overview of the mecanum wheel assembly.
Variable Control Charts (X chart & R chart)
There are several ways to identify if the process is Out-Of-Control:
- One or more points are outside of the control limits.
- Two or three consecutive points are outside the two-sigma warning limits.
- Four or five consecutive points are beyond the one-sigma limits.
- A run of 8 consecutive points are on one side of the center line.
The design specifies that the outer diameter of the central hub should be 435mm (core diameter).
We will analyze if the samples we selected are between control limits with the use of X chart and R
chart.
Control Chart for Variable
Out of Control

|
A&P Eco-MHEContChartVariable outofcontrol .xlsx Size : 20.44 Kb Type : xlsx |
Analysis of Control Chart for Variable
Here the area of focus is a variable control which is a single quality characteristic dimension.
As we are dealing with a variable control we monitor both the mean value of the quality
characteristic and the variability. For testing the outer diameter of the center hub we pick 5
different sample sizes a day and then run it for 25 days. When setting up X-bar and R control
charts, it is best to begin with the R chart. Because the control limits on the X-bar chart depend
on the process variability, unless process variability is in control.
According to the original specifications provided the outer diameter should be 436mm plus or minus
3mm. The analysis for 25 samples for 5days done is showed in the spreadsheet attached below.
Analysis of R-chart shows the values are within control limits and hence process is in control. But
analysis of X-chart shows that one point (i.e. point 14) is above the upper control limit and hence the
process is out of control. Therefore the process has to be checked and made sure that it is in control.
The chart shows the variable data collected from our manufacturing process of central hub.
Reasons:
There are 3 possible reasons for such an error to occur and a combination of these reasons:
1. Tool: The tool has worn out or the tool wasn’t mounted properly
2. Machining error: The personnel gave wrong cutting parameters while machining.
Solution:
The measuring instruments were checked for errors and were found to be accurate.
There was no chance that the parameters fed into the machine were wrong as the cutting is done on
a CNC machines and in batches with an automatic feed system. So if an error would have occurred
due to wrong machining parameters, errors would have been caused in all the jobs. So the
machining error rules out.
The tools were tested under several work loads and it was found that the cutting edge of the tool
underwent deformation after completion of specific number of jobs. QCT supplies single point cutting
tools to A&P Eco-MHE. QCT found out that the tools used had inserts did not have sufficient wear
resistance. QCT provided tungsten carbide inserts which were more stable under the heat produced
during machining.
Thus Quality carbide tools developed new set of tools which were featured by:
1. Higher cutting speeds
2. Larger depth of cuts
3. High resistance to abrasion
4. Hardness of HRC 93
Control Chart for Variable
In Control
|
|
A&P Eco-MHE ContChartVariable incontrol.xls Size : 53 Kb Type : xls |
Analysis of Control Chart for Variable (In Control)
As it can be seen that both the charts satisfies the tolerance criteria and no point on the chart are
out of limits and thus we can conclude that the process is in control. Analyzing the control charts for
variable is a significant step towards quality assurance as our main motive is customer satisfaction.
By using this, the company can invariably catch any defects in the lots and can take the corrective
steps as needed.
As can be seen on the R chart and the X bar Chart, there are no points past the control limits. There
are no seven consecutive points above or below the central lines (R-bar and the X-bar). And there
are no seven consecutive points in an increasing or decreasing trend. This tells us that the R and the
X bar processes are in control.
Thus use of tungsten carbide inserts have increased the wear resistance of the single point cutting
tool. Hence the process was brought under control. Note that Use of tungsten carbide inserts came
with a added benefit. As these tungsten carbide allowed larger depth of cuts the machining time
reduced.
Attribute Control Charts (C chart & U chart)
Some of the quality characteristics cannot be conveniently represented numerically, therefore, we
will use "defective" or "non-defective" to identify our quality characteristics. The fraction
nonconforming control charts has three parameters that must be specified: the sample size, the
frequency of sampling, and the width of the control limits.
C chart
|
|
A&P Eco-MHE CChart.xlsx Size : 17.149 Kb Type : xlsx |
Analysis of Control Chart for Attribute (C chart)
C-chart is a type of control chart used to monitor “count”-type data, typically total number of
non conformities per unit. Poisson distribution is the basis for the c-chart. It not only tracks the
number of non conformities, but also the type or location and therefore could provide vital information
on how to pin point the assignable cause.
The company makes use of the C-chart to detect and keep a close eye on the surface defects of the
rollers. As the rollers are made of soft rubber the surface of the rollers are to be inspected for surface
irregularities restricted to visibility to eye. The surface of the rollers play an crucial role in the smooth
mobility of the whole forklift and hence in the customer satisfaction.
From this we calculated the average number of non-conforming units, Upper Control Limit (UCL) and
Lower Control Limit (LCL) of the 30 samples. After plotting the average data of the 30 samples, when
the analysis of the process was done, it was found that the points are within the control limits and
there were no points outlying in non-conforming parts and also there were no 7 consecutive points
over or below the bar values so over all the process was classified as an in control process.
Thus to ensure that customer does not receive any item that is defective we ensure that all the
rollers have surface irregularities within tolerance total customer satisfaction.
U Chart
|
|
A&P Ec0-MHE_ uChart.xlsx Size : 16.654 Kb Type : xlsx |
Analysis of Control Chart for Attribute (U chart)
The u- chart is often used in quality control if the sample size is not a constant, but a variable. It plots
the number of nonconformity per unit tested.
The collaborating companies supply us with certain products such as cutting tools in mass. The
quality of these cutting tools are critical as quality of all the cutting processes depend upon the
quality of the tools.
It can be seen that the upper control limit and the lower control limit is varying and is not at a
constant value. The values are almost evenly distributed above and below the central line. The
spreadsheet attached below shows that all the points are within the control limits and hence the
process is in control. In the above process, there were no points outlying in non-conforming parts
and also there were no 7 consecutive points over or below the bar values so over all the process
was classified as an in control process.
Collaboration
With the process control analysis we A&P Eco-MHE can understand the process defects in details
and how engineering functions can be applied in order to satisfy the customer requirements with the
help of engineering solutions. A& P Eco-MHE had incorporated all the decisions and worked very
closely with the other four companies on Process control chart for continuous process improvement
and process analysis purpose. Our collaboration with the other four companies involves getting
solutions with latest process technology for our manufacturing process. They also provide us with
more quality consultants and advocate the latest TQM techniques. It includes modules for all the
phases of manufacturing process thus helping designers and manufactures with the exact data and
to implement the corrective steps, keeping the process in control. The Numina group will help us
maintain the product database. The products will be easily tracked back from suppliers customers
can get quick response and it will also help the company to make alterations to fix the process
defects.
The process control analysis will also help implement and trigger changes in order to obtain
continuous improvements in order to meet the company goals to attain customer defined quality and
functional requirements with an emphasis on sustainable green focus.
Summary
Utilization of process control chart by well trained professionals can prevent organization from
disaster and give a better future improvement plan. Statistical process control charts help to
establish mistake proof processes, develop upstream process controls, contribute to process and
product redesign, and as a result, help to monitor, and keep the processes under continuous
control. A process out-of-control must always be investigated properly. The quality team must
identify the sources of variation, and corrective action must be taken to bring the process back
within the control limits.
Our initial control chart shows that system progress is out of control and quality of central hub was
improved by improvements in the process and the customers will be satisfied through smooth
movement of the forklift with added accuracy.
References:
1. Paul G. Ranky, IE673 Total Quality Management eLearning Pack ID: IE673-Spring 2012-95-66
2. http://www.cimwareukandusa.com/All-Green/Ranky-GreenEngineering.html
3. http://www.cimwareukandusa.com/CIMpgr1.html.
5. http://www.boschrexroth.com
6. http://www.numinagroup.com/